2.7× Request Throughput: Introducing Java Virtual Threads
A read API hit a p95 latency of seven seconds in a load test. Requests weren't failing.
They were just slow. Throughput wouldn't climb past 16.6 requests per second either. Seven seconds wasn't something I could leave alone.
Since the API queried a database, I suspected the DB first. But its CPU was mostly idle. The congestion was on the application side: up to 36 requests were waiting to borrow connections from a HikariCP pool of four. Thirty-six requests queued for four connections.
At that point, the diagnosis looked obvious. Too few connections: the database was idle, but the narrow channel was holding requests up. Increasing the pool seemed like the answer.
Before acting on that diagnosis, something bothered me. If connections were the bottleneck, more connections should let the DB finish more work. But the DB was already idle. There was no guarantee that lending more connections and finishing requests faster would move together. Before changing the pool size, I decided to change one other variable: how we handled requests while they waited.
That variable was Java 21 virtual threads.
This isn't an introduction to virtual threads from scratch. I'll cover only what the experiment needs. They're worth reading up on separately.
Same connections, different threads
In the existing setup, a request held onto a platform thread while waiting for a connection or a query result. Platform threads map one-to-one to OS threads, so more waiting requests meant more OS threads had to remain alive. Waiting didn't burn CPU by itself, but the request stayed tied to its OS thread. This is the thread-per-request model Java has used for years.
Virtual threads handle that wait differently. The JVM runs a virtual thread on a platform thread, then detaches it at blocking points it can intercept, such as supported socket and JDBC operations. The platform thread—the carrier thread—can run another virtual thread while it waits.
Our API already spent a lot of time waiting: first for a connection, then for a query result. Could virtual threads let us handle more requests with the same number of connections?
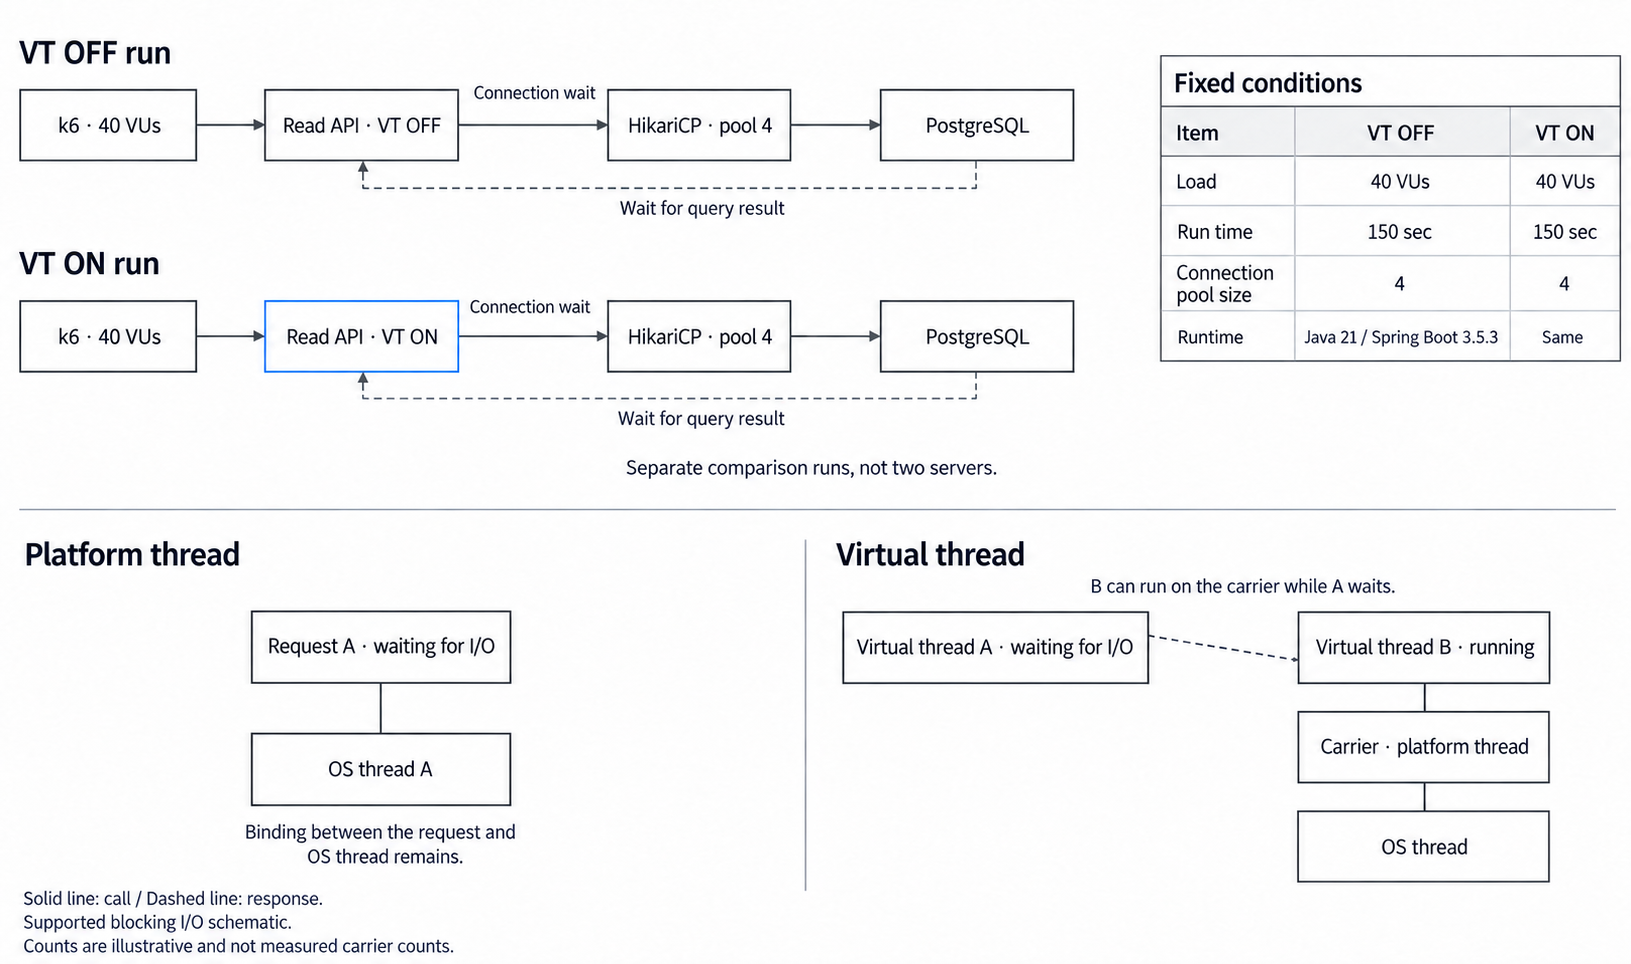
We were using Java 21 and Spring Boot 3.5.3, so enabling it took one setting.
spring.threads.virtual.enabled=true
I ran the tests in local Docker containers limited to 0.5 vCPU and 1 GB, matching the production tasks. I wanted to compare one setting, not establish absolute production performance, so I kept the resource limits constant and toggled VT. I tested three different read APIs, called Read A, B, and C below. Each ran for 150 seconds with 40 virtual users.
A VU is a virtual user repeating the same scenario. With the user count fixed, faster responses let the same users send their next requests sooner. I compared throughput and response times under that condition.
Throughput rose, but the queue stayed
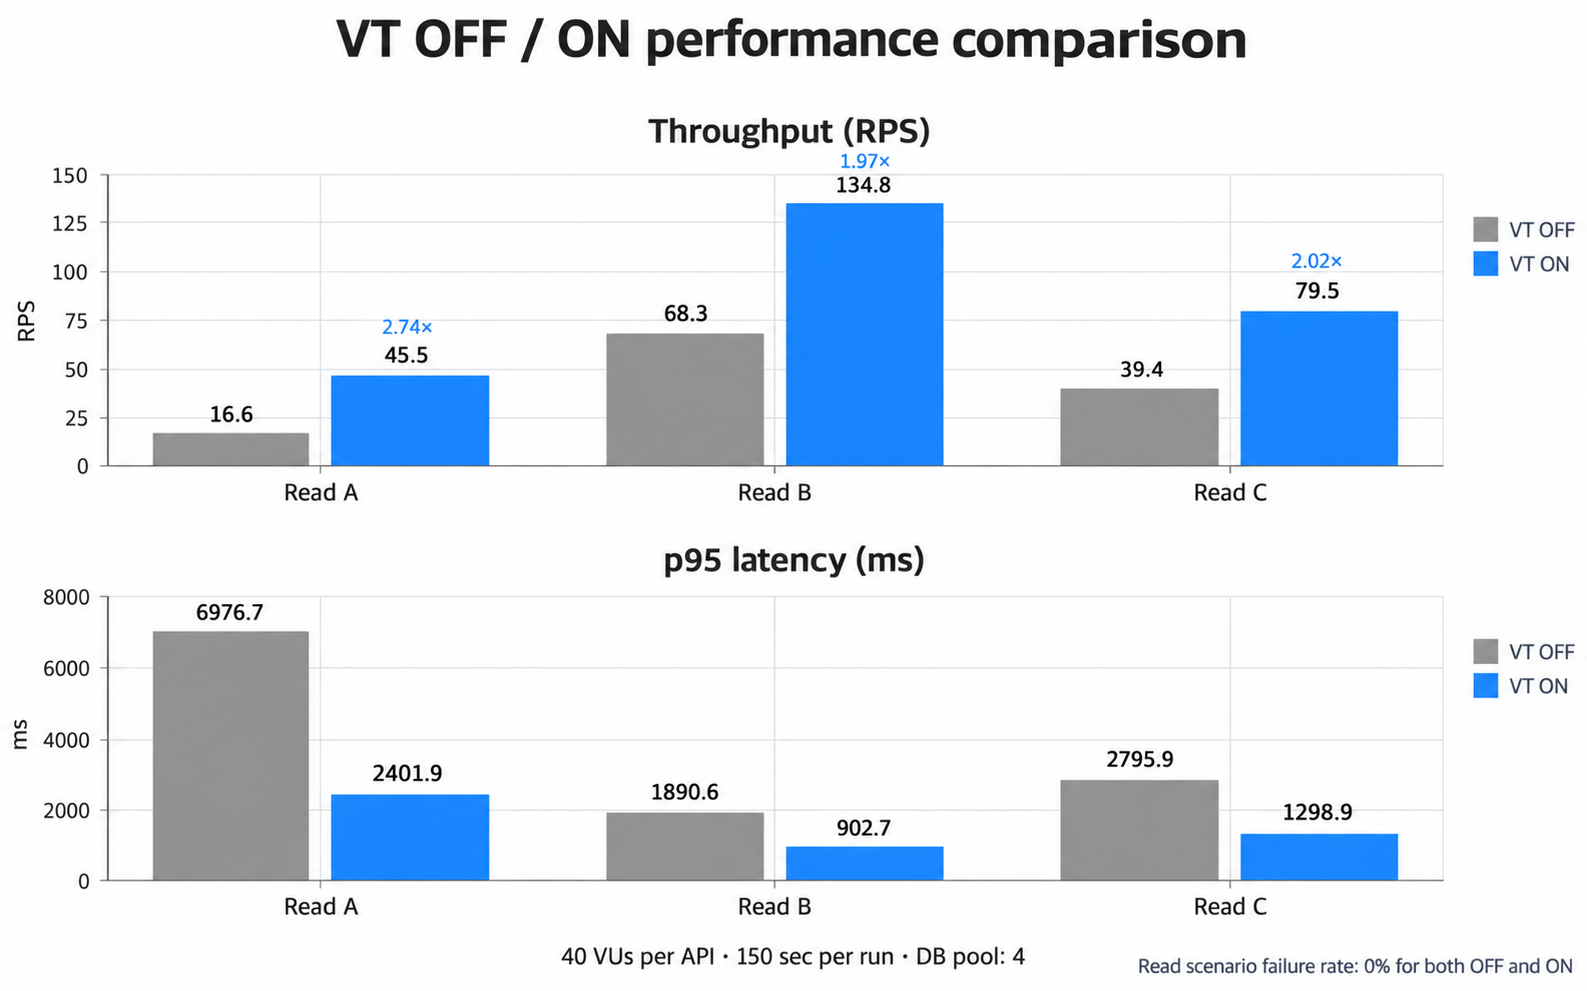
Read A, the original problem, went from 16.6 to 45.5 RPS: 2.74×. Its p95 dropped from seven seconds to 2.4. The other two roughly doubled throughput and nearly halved p95. The failure rate was 0% both before and after.
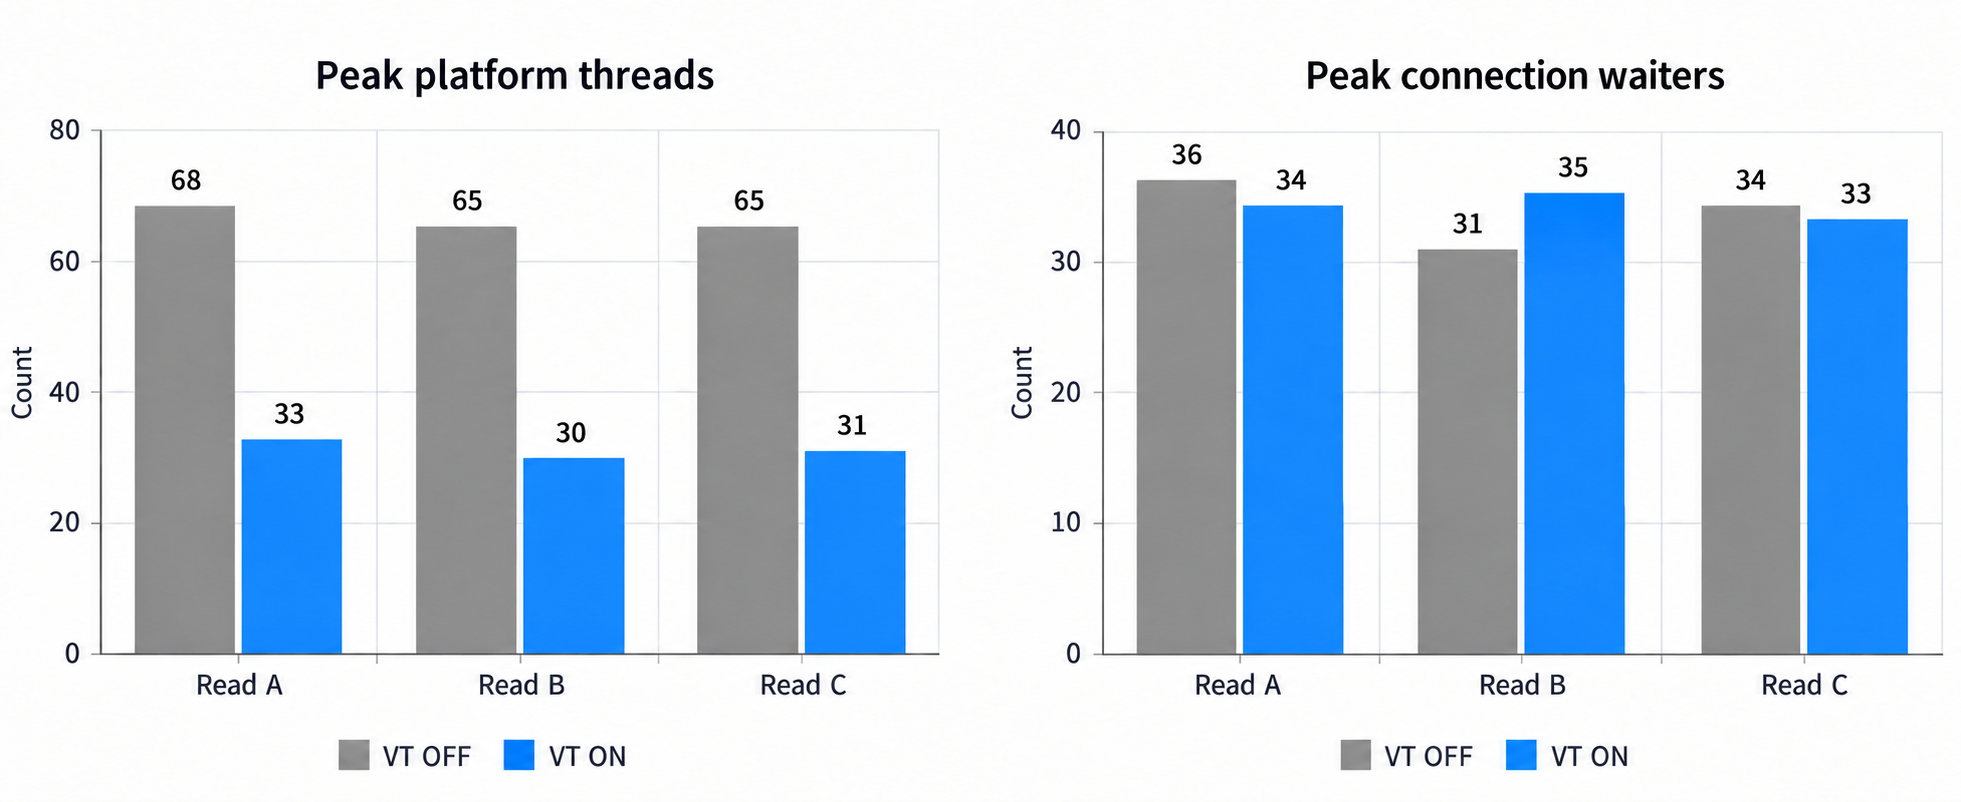
Internally, platform-thread counts fell. For Read A, the peak dropped from 68 to 33. B and C behaved similarly. But connection wait queues stayed in the thirties for all three APIs. Read A went from 36 to 34—essentially unchanged.
That contradicted my first diagnosis. The pool still had four connections and the queue was still about the same size, yet throughput rose 2.74×. If nothing changed at the connection-lending layer, that wasn't where the improvement came from.
Little's law makes the situation clearer. Assuming all four connections stay busy, throughput is inversely proportional to the average time each is held. At 16.6 RPS, that works out to roughly 240 ms per connection; at 45.5 RPS, about 88 ms. We weren't lending more connections. Requests were holding each one for less time.
Why were they holding connections for less time? I checked CPU. Before and after enabling VT, the application was near its limit of 50%—essentially all of its 0.5 vCPU. Both saturated CPU, but one finished 2.74× as many requests. Each request had become cheaper.
I didn't directly measure context-switch counts. But the reduction from 68 platform threads to a handful of carriers moved alongside lower CPU cost per request. The most plausible explanation was that scheduling 68 platform threads on half a core was expensive. With VT, fewer OS threads competed to run, and the saved CPU could go toward processing requests.
So eliminating the connection queue wasn't my success criterion. I wanted to know whether the same pool could process more work with fewer threads. It could. At that point, the ‘connection bottleneck’ diagnosis started to weaken.
Requests waiting for AI inference
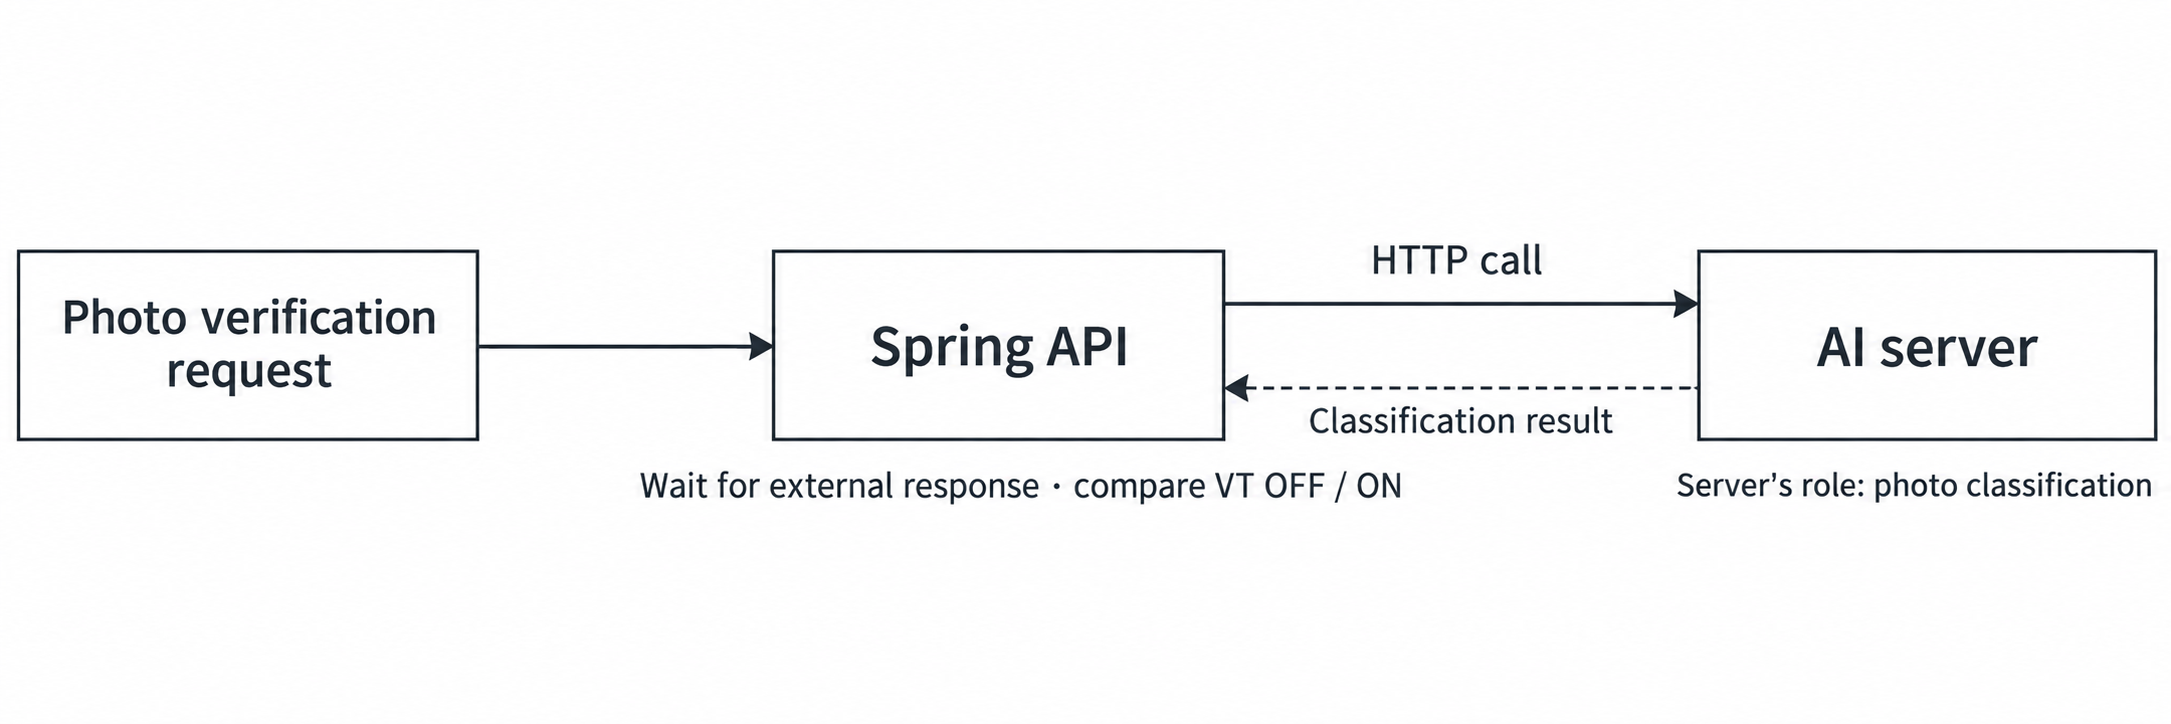
I also tested an AI inference path. A separate model server classified photos; our Spring API called it over HTTP and waited for the result.
Moving model computation outside the API doesn't end the request. The user is still waiting, and our API needs the result before continuing. VT was again about waiting, not speeding up the model: holding pending requests cheaply while the other server computed. Releasing the carrier to another virtual thread also worked for these external calls.
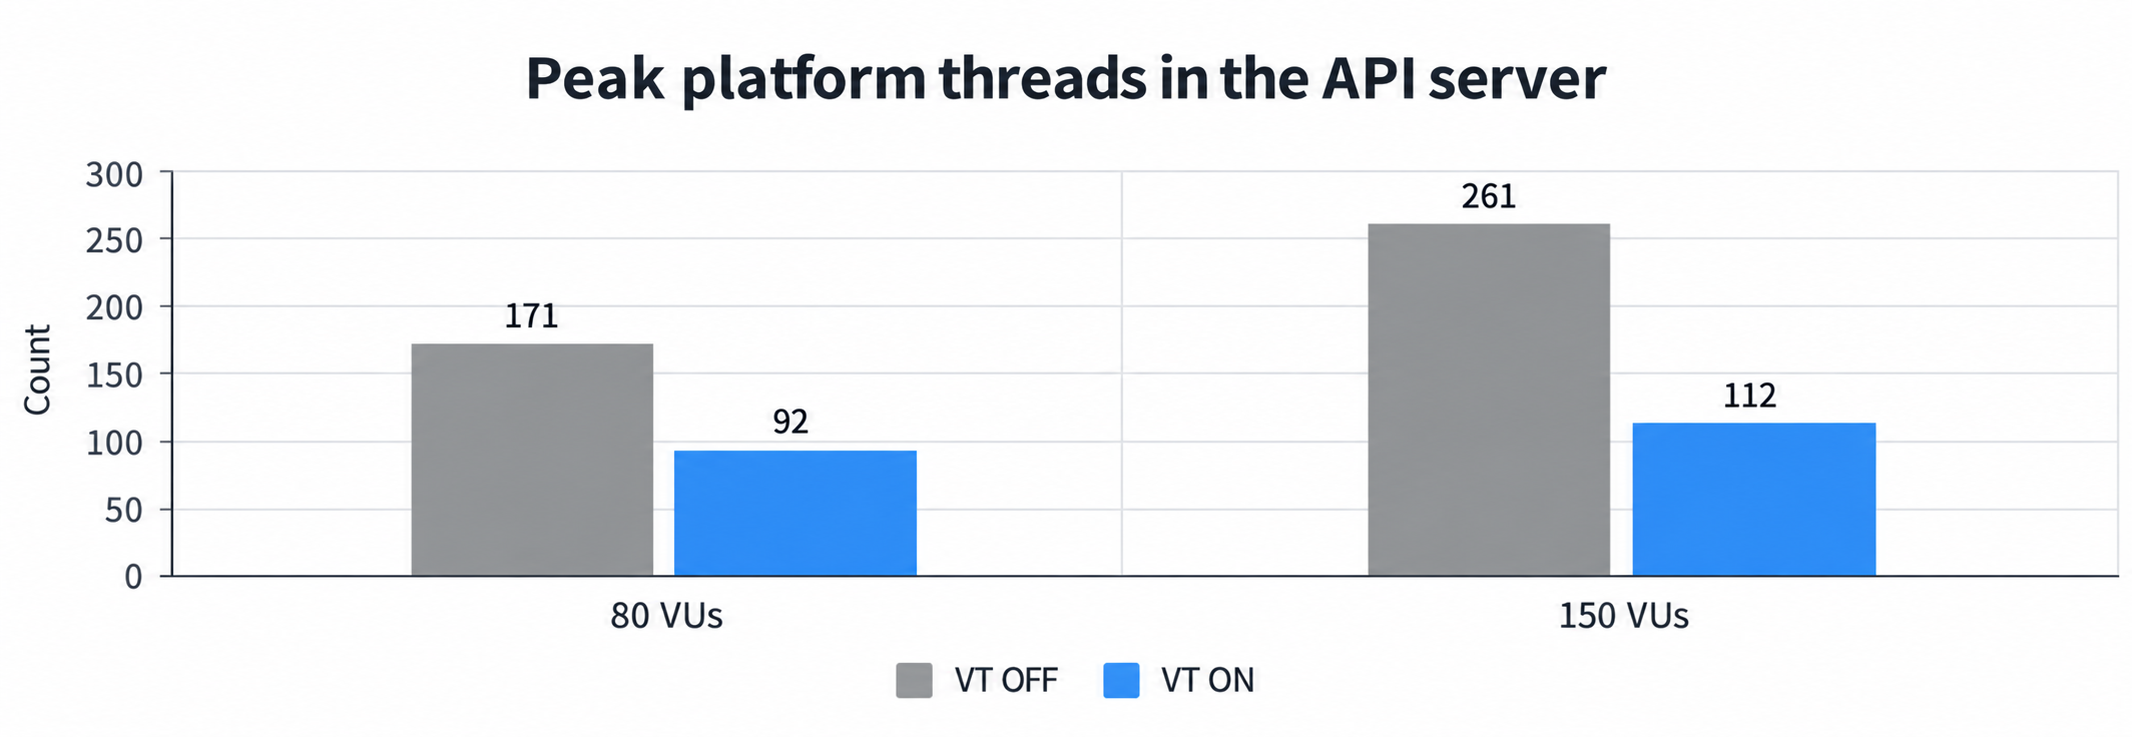
Here I measured platform threads in the calling API, not model performance. With 80 VUs, the peak fell from 171 to 92; with 150 VUs, from 261 to 112. The external HTTP path showed the same direction as the read APIs.
There was a catch. VT only made our waiting cheaper; it didn't increase the AI server's capacity. Removing our thread ceiling let more requests reach that server concurrently. After enabling VT, failures rose from 0% to 15–25%, all 503 responses caused by the AI server exceeding its concurrency limit. Throughput increased, but we also pushed more load downstream. This path needs its own concurrency limit, independently of VT. I focused this article on reads and left that as follow-up work.
Would more connections help too?
VT improved throughput. Now it was time to revisit the question I'd postponed. The connection queue was still long. If four connections performed this much better, perhaps more would help.
This time, I kept VT on and changed only the pool size: 4 → 8 → 16 → 32. The target was Read A, with 64 VUs.
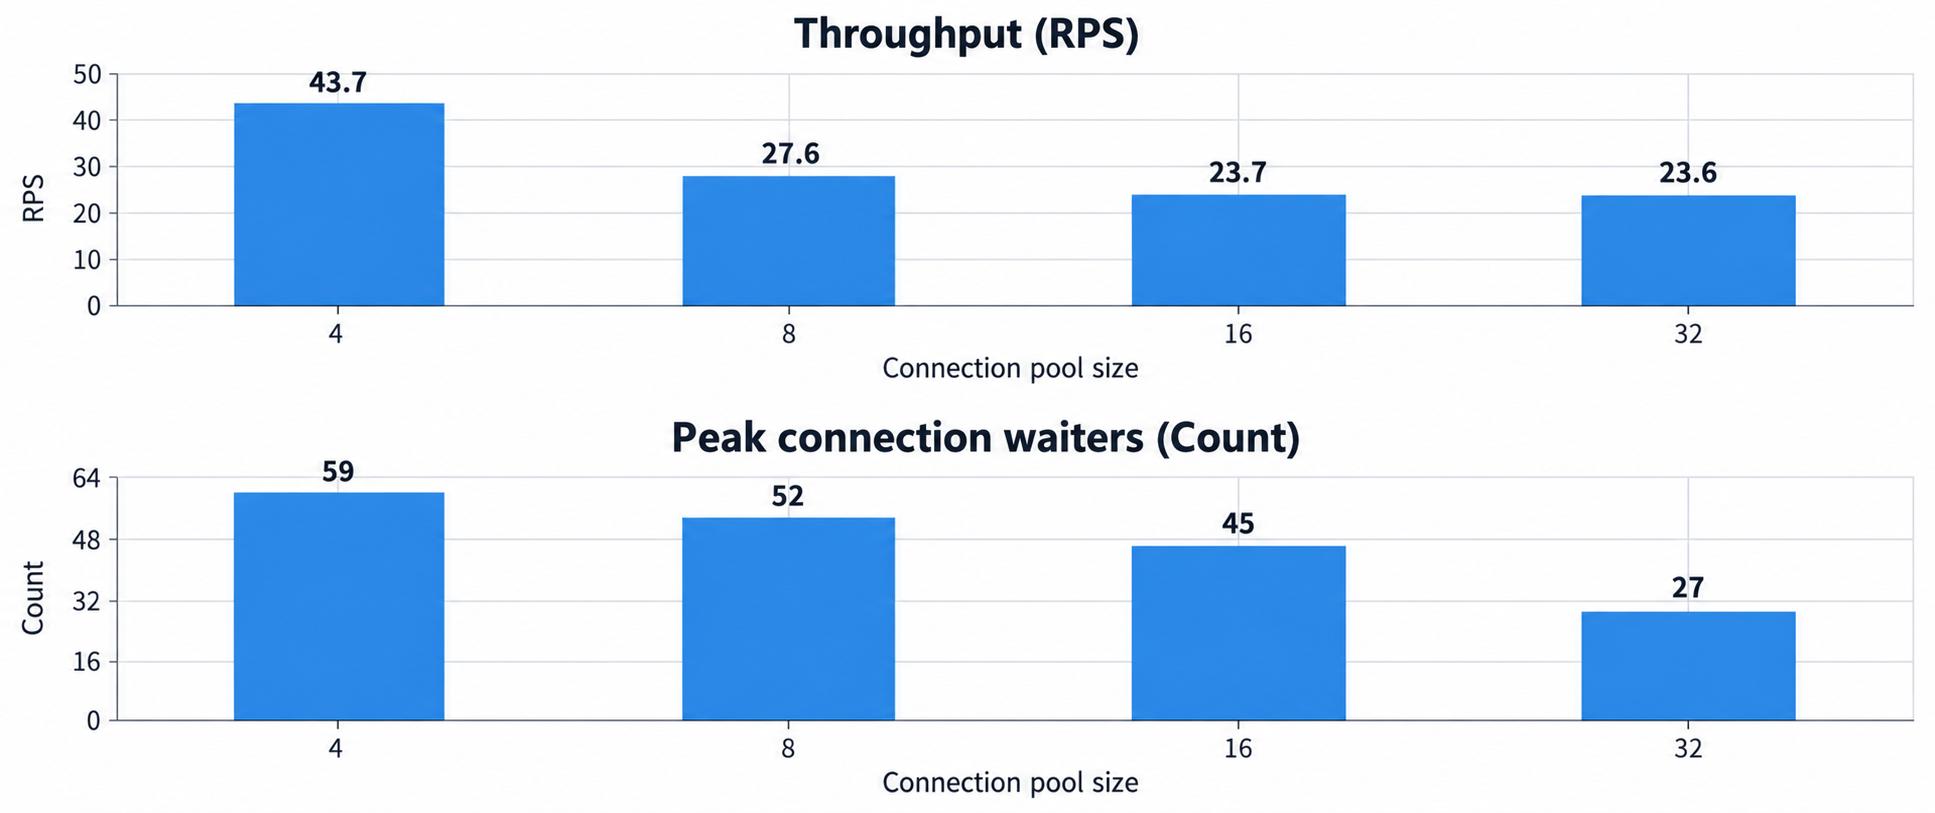
Increasing the pool from 4 to 32 cut the waiting queue from 59 to 27, but throughput fell from 43.7 to 23.6 RPS. Exactly the opposite of what I'd expected.
The absolute values varied on half a core. Two runs with a pool of four returned 43.7 and 32.3 RPS. But both runs at 32 were lower—23.6 and 22.6—and the direction remained the same: more connections made things worse.
Looking only at the waiting queue, I would have called this an improvement. The queue clearly got shorter. But the API wasn't processing requests better.
This result broke the original diagnosis. If connections were the bottleneck, more should let the DB finish more work. Instead, committed transactions fell from 131 to 75 per second. Borrowed connections peaked at 31, while the DB was executing only about one query at a time. Those numbers didn't fit the hypothesis.
Throughput peaking and then declining as concurrency rises is a familiar shape: the retrograde region described by the Universal Scalability Law. More parallelism brings more coordination cost, and past a point that cost outweighs the gain. With 0.5 vCPU, that point comes early. In our case, a pool of four was already close to it.
Comparing borrowed connections with completed DB work
I didn't stop at application metrics. I also checked how much work the database completed. These values came from the pool-size experiments at 4, 8, 16, and 32.
| Pool size | Peak borrowed connections | DB commits/s | Average DB CPU |
|---|---|---|---|
| 4 | 4 | 131.2 | 7.1% |
| 8 | 8 | 84.3 | 5.7% |
| 16 | 16 | 74.7 | 6.8% |
| 32 | 31 | 74.7 | 8.2% |
Connection usage is the peak during load. DB commits/s is the increase in xact_commit divided by the observation period.
With a pool of 32, borrowed connections peaked at 31. It wasn't simply a larger setting that went unused. Yet commits fell from 131 to 75 per second, and DB CPU stayed in single digits. Application CPU remained at its 50% limit throughout.
Borrowed connections and the rate at which the DB finishes work are different measurements. HikariCP counts a connection as active while the application has borrowed it and hasn't returned it. Much of that time was application CPU work—mapping results to objects and building responses—not query execution. That's why 31 borrowed connections could coexist with roughly one executing query, and why more connections didn't mean more completed DB work. Connections were acting less like doors to the DB and more like admission tickets to the application's CPU workbench.
Keeping the VT result separate from pool sizing
Putting the two experiments side by side made the decision straightforward. With the pool unchanged, enabling VT increased throughput. With VT enabled, increasing the pool decreased it.
Both settings concern concurrent requests, so it can look as if they should increase together. Here, they moved in opposite directions. VT reduced per-request overhead. A larger pool added more work to an already saturated CPU. Both results pointed to the same constraint: application CPU, not connections.
I kept the VT improvement and left the pool at four.
Conclusion: four connections, up to 2.74× throughput
The final choice for the read paths was virtual threads ON and a HikariCP pool of four. Here are the before-and-after results for the three APIs used in that decision.
| API | Throughput (RPS) | Throughput multiplier | p95 (s) | p95 reduction | Peak platform threads |
|---|---|---|---|---|---|
| Read A | 16.6 → 45.5 | 2.74× | 6.98 → 2.40 | 65.6% | 68 → 33 |
| Read B | 68.3 → 134.8 | 1.97× | 1.89 → 0.90 | 52.3% | 65 → 30 |
| Read C | 39.4 → 79.5 | 2.02× | 2.80 → 1.30 | 53.5% | 65 → 31 |
VT OFF → ON, 40 VUs for 150 seconds per API, identical resource limits and a pool of four.
p95 reductions were calculated from unrounded values.
Read A, which started at a seven-second p95, ended at 2.4 seconds. Its peak platform-thread count fell from 68 to 33.
I initially thought four connections were too few. What was lacking wasn't connections, but an efficient way to share half a core across requests. Connections led to an idle database; CPU for processing requests was the scarce resource. Keeping the pool fixed and changing how we handled requests took Read A from 16.6 to 45.5 completed requests per second.
Increasing concurrency can increase throughput when CPU capacity remains. Once CPU is the bottleneck, it is closer to cutting the same pie into smaller pieces. The connection queue was simply the first conspicuous number in this problem.